The OFFICIAL programming thread
-
@Hog said in The OFFICIAL programming thread:
@Zeppelin said in The OFFICIAL programming thread:
I dont have the corresponding table built with that static number running across all the date value
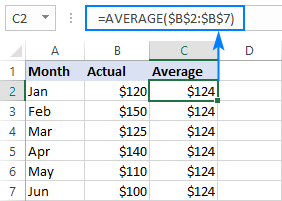
Can’t you just use the same table where the variable data is coming from and insert a column? Enter the static value and let Excel auto fill it out down the entire range.
It is what I did, but the y value just says 65.5. It would need to say that 12 times, I think. As a range of values.
I feel there is a switch to put in there next to the 65.5
-
What Hog said. You need to add a value of 65.5 for every value of X in your data source.
How to add a line in Excel graph: average line, benchmark, etc.
See how to add a horizontal a line in Excel chart such as an average line, baseline, benchmark, trend line, etc.
-
ffs
-
Use Microsoft Paint
GTFO
-
-
-
He’s got a point. you already drew the lines so it’s probably faster to just write in the numbers than google “Excel for Dummies” and read through that.
-
@Gators1 said in The OFFICIAL programming thread:
He’s got a point. you already drew the lines so it’s probably faster to just write in the numbers than google “Excel for Dummies” and read through that.
I am a professional and that is Bush league.
Bush league!!
-
I thought you worked for the government? I have seen worse charts come from the government.
-
@Gators1 said in The OFFICIAL programming thread:
I thought you worked for the government? I have seen worse charts come from the government.
Yes but I, personally, am a professional. I don’t settle for trash. Besides, drawing it might be close, but not exact.
-
@Zeppelin said in The OFFICIAL programming thread:
@Gators1 said in The OFFICIAL programming thread:
I thought you worked for the government? I have seen worse charts come from the government.
Yes but I, personally, am a professional. I don’t settle for trash. Besides, drawing it might be close, but not exact.
You trust Bill Gates to make it exact? How do you know he doesn’t half ass it in Excel and tell your vaccine to make you believe it’s exact?
-
AI has automated everyone!
You can upload stuff into Chat GPT 4 like pictures, data or whatever. So it will photoshop shit for you, make charts from the data and even interact with the web. In this one video, Pakoon’s graphic design shit is automated, Jerry’s recipes, Zeppelin’s graphing failures, Tigger’s math, all the IT dudes’ programming, etc. The plugin thing is going to be interesting to see what people develop.
-
I hate how much this resonates with me:

-
Whenever I’ve quoted a job based upon an engineer’s estimate whose work I know, I have always multiplied the estimated time to completion by four.
I’ve been off at times because I failed to estimate the time to completion by six.
-
@Hog said in The OFFICIAL programming thread:
I hate how much this resonates with me:
I hate the PM profession sooooooo much…
-
Prime Minister?
-
Project manager
-
-
He didn’t say farming project manager.
-


