Off Topic
    • Categories
    • Tags
    • Users
    • Groups
    • Amazon
    • OT Fundraiser
    • Register
    • Login

    The OFFICIAL programming thread

    Tech
    22
    1.4k
    10.5k
    Loading More Posts
    • Oldest to Newest
    • Newest to Oldest
    • Most Votes
    Reply
    • Reply as topic
    Log in to reply
    This topic has been deleted. Only users with topic management privileges can see it.
    • KilemallK
      Kilemall Careful, railroad agent @Gators1
      last edited by

      @Gators1 said in The OFFICIAL programming thread:

      @Hog said in The OFFICIAL programming thread:

      I could see myself using this to create whole cities one day:

      Reddit: GPT-4 to Blender

      Someone is gonna be pissed if you create a whole medival village complete with peasants with all their body parts in 5 minutes.

      Finnish modeling cobblers thrown out of work by globalist AI!

      https://i.imgur.com/hX2CMMZ.jpg

      Never go full Lithu-
      Twain

      No editing is gonna save you now-
      Wingmann

      http://s3.amazonaws.com/rrpa_photos/72217/DSC_2528.JPG

      http://s3.amazonaws.com/rrpa_photos/20416/PTOB 101_resize.jpg

      1 Reply Last reply Reply Quote 0
      • TazzT
        Tazz
        last edited by

        image.png

        GTFO

        1 Reply Last reply Reply Quote 2
        • Gators1G
          Gators1
          last edited by

          Apr 4, 2023  /  ChatGPT

          Samsung workers made a major error by using ChatGPT

          Samsung workers made a major error by using ChatGPT

          Samsung meeting notes and new source code are now in the wild after being leaked in ChatGPT

          alt text

          ? 1 Reply Last reply Reply Quote 2
          • ?
            A Former User @Gators1
            last edited by

            @Gators1 said in The OFFICIAL programming thread:

            Samsung meeting notes and new source code are now in the wild

            Interesting enough article without the lying, clickbait intro text.

            I guess the fuckers got me to read it.

            1 Reply Last reply Reply Quote 0
            • ?
              A Former User
              last edited by

              Nerds, to me!

              I have an Excel line chart plotted, but want to add a static line to it. By static I mean the value is the same across all 12 months, so its just a straight horizontal line. If I do x-y with y being the value, and x being the dates, it doest draw a line, it just plots the one value at the first date. Now this is because I dont have the corresponding table built with that static number running across all the date value, its just too much work

              I think i’'ve done this before years ago, but I also used Sigma Plot back then so maybe not.

              Dis blue line

              image.png

              ? O 2 Replies Last reply Reply Quote 0
              • ?
                A Former User @A Former User
                last edited by

                @Zeppelin said in The OFFICIAL programming thread:

                I dont have the corresponding table built with that static number running across all the date value

                Can’t you just use the same table where the variable data is coming from and insert a column? Enter the static value and let Excel auto fill it out down the entire range.

                ? 1 Reply Last reply Reply Quote 1
                • ?
                  A Former User @A Former User
                  last edited by

                  @Hog said in The OFFICIAL programming thread:

                  @Zeppelin said in The OFFICIAL programming thread:

                  I dont have the corresponding table built with that static number running across all the date value

                  Can’t you just use the same table where the variable data is coming from and insert a column? Enter the static value and let Excel auto fill it out down the entire range.

                  It is what I did, but the y value just says 65.5. It would need to say that 12 times, I think. As a range of values.

                  I feel there is a switch to put in there next to the 65.5

                  1 Reply Last reply Reply Quote -1
                  • Gators1G
                    Gators1
                    last edited by

                    What Hog said. You need to add a value of 65.5 for every value of X in your data source.

                    How to add a line in Excel graph: average line, benchmark, etc.

                    How to add a line in Excel graph: average line, benchmark, etc.

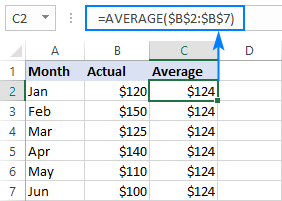
                    See how to add a horizontal a line in Excel chart such as an average line, baseline, benchmark, trend line, etc.

                    alt text

                    1 Reply Last reply Reply Quote 0
                    • ?
                      A Former User
                      last edited by

                      ffs

                      1 Reply Last reply Reply Quote -1
                      • TazzT
                        Tazz
                        last edited by

                        Use Microsoft Paint

                        GTFO

                        rote7R ? 2 Replies Last reply Reply Quote 2
                        • rote7R
                          rote7 @Tazz
                          last edited by

                          @Tazz said in The OFFICIAL programming thread:

                          Use Microsoft Paint

                          Damn, you beat me to it.

                          fffg

                          1 Reply Last reply Reply Quote 2
                          • ?
                            A Former User @Tazz
                            last edited by

                            @Tazz said in The OFFICIAL programming thread:

                            Use Microsoft Paint

                            Or a sharpie

                            I mean…

                            1 Reply Last reply Reply Quote 0
                            • Gators1G
                              Gators1
                              last edited by

                              He’s got a point. you already drew the lines so it’s probably faster to just write in the numbers than google “Excel for Dummies” and read through that.

                              alt text

                              ? 1 Reply Last reply Reply Quote 0
                              • ?
                                A Former User @Gators1
                                last edited by

                                @Gators1 said in The OFFICIAL programming thread:

                                He’s got a point. you already drew the lines so it’s probably faster to just write in the numbers than google “Excel for Dummies” and read through that.

                                I am a professional and that is Bush league.

                                Bush league!!

                                1 Reply Last reply Reply Quote 0
                                • Gators1G
                                  Gators1
                                  last edited by

                                  I thought you worked for the government? I have seen worse charts come from the government.

                                  alt text

                                  ? 1 Reply Last reply Reply Quote 0
                                  • ?
                                    A Former User @Gators1
                                    last edited by

                                    @Gators1 said in The OFFICIAL programming thread:

                                    I thought you worked for the government? I have seen worse charts come from the government.

                                    Yes but I, personally, am a professional. I don’t settle for trash. Besides, drawing it might be close, but not exact.

                                    Gators1G 1 Reply Last reply Reply Quote 0
                                    • Gators1G
                                      Gators1 @A Former User
                                      last edited by

                                      @Zeppelin said in The OFFICIAL programming thread:

                                      @Gators1 said in The OFFICIAL programming thread:

                                      I thought you worked for the government? I have seen worse charts come from the government.

                                      Yes but I, personally, am a professional. I don’t settle for trash. Besides, drawing it might be close, but not exact.

                                      You trust Bill Gates to make it exact? How do you know he doesn’t half ass it in Excel and tell your vaccine to make you believe it’s exact?

                                      alt text

                                      1 Reply Last reply Reply Quote 1
                                      • Gators1G
                                        Gators1
                                        last edited by

                                        AI has automated everyone!

                                        You can upload stuff into Chat GPT 4 like pictures, data or whatever. So it will photoshop shit for you, make charts from the data and even interact with the web. In this one video, Pakoon’s graphic design shit is automated, Jerry’s recipes, Zeppelin’s graphing failures, Tigger’s math, all the IT dudes’ programming, etc. The plugin thing is going to be interesting to see what people develop.

                                        OpenAI’s GPT-4 Just Got Supercharged!

                                        alt text

                                        1 Reply Last reply Reply Quote 2
                                        • ?
                                          A Former User
                                          last edited by

                                          I hate how much this resonates with me:

                                          3vtlt3cwlrta1.jpg

                                          KilemallK 1 Reply Last reply Reply Quote 4
                                          • JamJ
                                            Jam
                                            last edited by Jam

                                            Whenever I’ve quoted a job based upon an engineer’s estimate whose work I know, I have always multiplied the estimated time to completion by four.

                                            I’ve been off at times because I failed to estimate the time to completion by six.

                                            "laissez les bons temps rouler!"

                                            1 Reply Last reply Reply Quote 1
                                            • First post
                                              Last post