The OFFICIAL programming thread
-
Nerds:

I had to search through the comments before I learned they were talking about GitHub activity:

-
That’s a pretty good chart showing how many times I delete and start over.
-

-
Kind of funny video and interesting idea. Maybe I should be using this for LOT so Lithu doesn’t steal my secretz.
-

-
-
@Lob12 's gotta get paid…
-
M$ is all in on AI. Already integrated in Office 365 and for once they came up with something useful.
-
I could see myself using this to create whole cities one day:
-
@Hog said in The OFFICIAL programming thread:
I could see myself using this to create whole cities one day:
Someone is gonna be pissed if you create a whole medival village complete with peasants with all their body parts in 5 minutes.
-
@Gators1 said in The OFFICIAL programming thread:
@Hog said in The OFFICIAL programming thread:
I could see myself using this to create whole cities one day:
Someone is gonna be pissed if you create a whole medival village complete with peasants with all their body parts in 5 minutes.
Finnish modeling cobblers thrown out of work by globalist AI!
-

-
 Samsung workers made a major error by using ChatGPT

Samsung meeting notes and new source code are now in the wild after being leaked in ChatGPT
-
@Gators1 said in The OFFICIAL programming thread:
Samsung meeting notes and new source code are now in the wild
Interesting enough article without the lying, clickbait intro text.
I guess the fuckers got me to read it.
-
Nerds, to me!
I have an Excel line chart plotted, but want to add a static line to it. By static I mean the value is the same across all 12 months, so its just a straight horizontal line. If I do x-y with y being the value, and x being the dates, it doest draw a line, it just plots the one value at the first date. Now this is because I dont have the corresponding table built with that static number running across all the date value, its just too much work
I think i’'ve done this before years ago, but I also used Sigma Plot back then so maybe not.
Dis blue line

-
@Zeppelin said in The OFFICIAL programming thread:
I dont have the corresponding table built with that static number running across all the date value
Can’t you just use the same table where the variable data is coming from and insert a column? Enter the static value and let Excel auto fill it out down the entire range.
-
@Hog said in The OFFICIAL programming thread:
@Zeppelin said in The OFFICIAL programming thread:
I dont have the corresponding table built with that static number running across all the date value
Can’t you just use the same table where the variable data is coming from and insert a column? Enter the static value and let Excel auto fill it out down the entire range.
It is what I did, but the y value just says 65.5. It would need to say that 12 times, I think. As a range of values.
I feel there is a switch to put in there next to the 65.5
-
What Hog said. You need to add a value of 65.5 for every value of X in your data source.
How to add a line in Excel graph: average line, benchmark, etc.
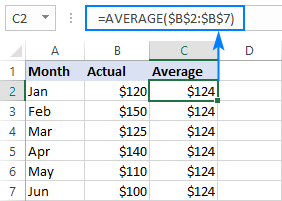
See how to add a horizontal a line in Excel chart such as an average line, baseline, benchmark, trend line, etc.
-
ffs
-
Use Microsoft Paint
GTFO

 the most SECURE browser!! (testing it with malware)
